Marketing metrics matter because smart marketing is built on the shoulders of solid data. Those who dare fly blind in the business analytics world eventually spot disaster on the horizon. So, which shall you choose? Understand the marketing metric or deny its existence?
For those who chose the former, welcome to your guide to the wonderful world of digital marketing metrics. We’re going to dash through a variety of variables bound to get your digits (i.e. fingers & numbers) dancing as you pounce on your favorite analytics app to follow along.
This article covers 25 key marketing metrics to track to ensure your strategies are producing favorable results.
But First – Understand How To Define Success in Your Marketing Efforts
General Marketing Metrics
1. Return on Investment
Return on investment (ROI) is one of the most important metrics in all of marketing, especially for agency clients. Those uninitiated in marketing lingo rarely want to know anything else other than whether or not their money spent is making money back.
ROI is, essentially, a campaign’s profit and revenue growth across all marketing channels including social media, ads, website, and more. ROI is vital to a campaign’s success because it’s the ultimate measuring stick for your marketing efficacy.
A positive ROI lets you know your campaign is converting and adding to your bottom line. A negative ROI means you have to make some adjustments to your offer or funnel.
There’s no doubt that marketing campaigns need clear data to run effectively. There’s nary a better way to see which of your channels is performing better than finding out its ROI. While attribution is getting increasingly difficult with a large swath of channels debuting on the digital landscape daily, successful marketing teams can discover ROI and pivot their plans accordingly.
2. Form submissions
Form submissions refers to the number of times a form was completed on a single landing page. Since forms are normally grouped together with a call-to-action (CTA) directing users to a lead magnet or special offer, form submissions can be a great measurement of how people are receiving your offer and for tracking qualified leads.
This metric won’t tell you what to do to make your forms perform better, but it tells you if they’re performing well at all. Once you have that information, you can choose to use something like a heatmap or analysis of partially submitted forms to see where your potential customers are dropping off at.
3. Conversion rates
If you want to know how many of your prospects are turning into actual customers, look at your conversion rates.
Conversion rates are immensely important and tie back to your ROI. Generally speaking, a positive ROI means you are converting prospects into customers and making money. But, just how many of these prospects are turning into customers? That’s what your conversion rate tells you.
Depending on your goal, your conversion rate can be a monetary value, the number of converted customers compared to overall traffic, or the number of times a user clicked on a button. A conversion is essentially a completed goal and the conversion rate is the rate at which that goal was completed.
For example, if you have 100 customers coming into your store everyday, and you convert 20 of those potential buyers into customers, you’d have a 20% daily conversion rate. Find out the conversion rate benchmarks for your industry and compare to see if you’re in striking range of competitors.
On-site content metrics
1. Total traffic
Total traffic refers to the amount of website visitors your site or landing page is generating. This is a good measurement for overall performance. With enough data, you should be able to spot trends in customer acquisition. Total traffic data can be broken down and segmented further into total traffic per channel, too, so you can see which marketing channels are performing better than others.
A universal rule is to make sure your total traffic continues rising. If it drops suddenly or if there’s an extended plateau, you may want to take a look at how you’re spending your marketing budget.
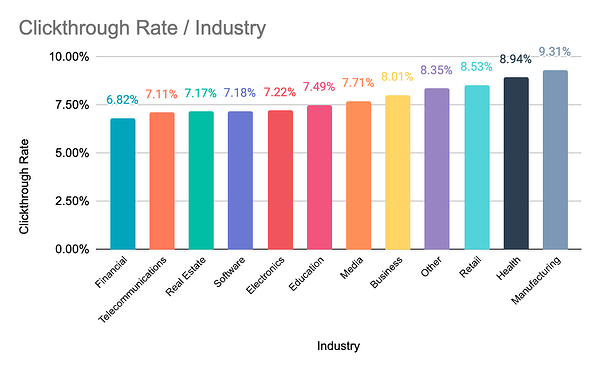
2. Click-through rates (CTR)
A click-through is when someone clicks on your ad’s CTA button to go to the next stage of your funnel. Click-through rate is important because it speaks to the relevance of your content. A high CTR means users find your ad relevant while a low CTR means users are not finding your ad relevant.
In the simplest of terms, click-through rate is the percentage of impressions that resulted in a click. So, if you have a PPC ad that generates 100 impressions and 10 clicks, you have a 10% click-through rate.
Many marketers search for the holy grail of this metric: industry benchmarks. But, the truth is there is no magic number. Your CTR depends on three factors:
- Your industry
- Your keywords
- Your budget
CTR also contributes to your ad’s rank, which is the position of your ad on the search results page.
3. New and returning visitors
New visitors have never been to your site before. Returning visitors are just that–individuals who are visiting your site for a second, third, or umpteenth time. Google tracks these two very different interactions by placing a tracking cookie on visitors’ devices so it informs Google when they return.
Spotting trends in your new and returning customers helps you visualize your marketing funnel. It’s likely that new & returning customers behave in different ways. Your task with this metric is to see when and where customers are converting.
Once you’re able to see where they’re converting, you can adjust your marketing funnel to ensure your messaging is hitting these two separate types of customers in different ways and at different times
4. Bounce rates
If a user goes to your landing page and exits without clicking a button or anything else, that is a bounce. A bounce is a single-page session that results in no actions. The bounce rate, then, is single-page sessions (a “session” is the timespan when a user first visits your site until they exit) divided by total sessions.
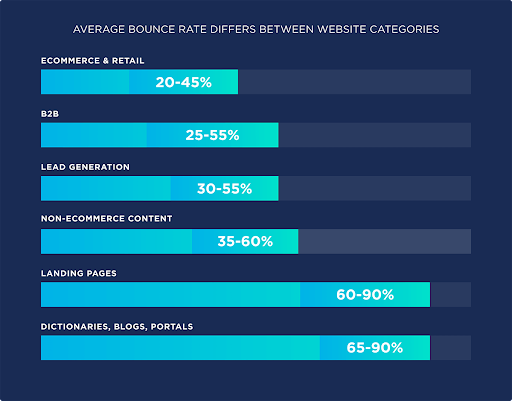
Credit: Backlinko
For most businesses, a high bounce rate is a bad thing. This means users are getting to your page and exiting without any other actions, like form completions or conversions, completed. If you have a single page site or something like a “squeeze page” set up, then a high bounce rate isn’t something you need to particularly pay attention to.
5. Downloads
Downloads is an engagement metric that tells marketers and business owners how much of a digital asset was acquired by users. Since a download is essentially a gated asset, meaning it’s hidden behind an action that unlocks it, measuring the amount of downloads tells you how much interest a piece of content generates.
This is important because if users are engaging with a specific piece of content more than others, you know that type of content is something you should be creating more of.
SEO Metrics
1. Organic traffic
Organic traffic consists of users that find your site’s content through search engine results. When a user inputs a search term into a search engine like Google, the search engine processes the user’s search intent and displays content listings it believes the user would like to engage with.
So, for example, if we search for “toy store” on Google, it’ll show toy stores in our area that we can visit. These are local search results because Google believes we intend to visit a toy store. If Google believed our search intent was to buy a toy store, it might show realtors who specialize in commercial real estate.
Measuring organic traffic metrics has a number of uses, chief among them is how well your content is ranking for the keywords you optimized for. If you have low organic traffic, you have not optimized your content properly. If your organic traffic is high for a page or post, then on-page and off-page (e.g. metadata) search engine optimization (SEO) was completed properly.
Actions that have shown to increase organic traffic include:
- Optimizing underperforming content
- Finding new keyword opportunities
- Write new content to increase ranking keywords
- Optimize site architecture
- Leverage featured snippets
- Optimize metadata for a better CTR
2. Keyword rankings
It’d behoove every marketer and business owner to monitor how their site is ranking for keywords. Why? Because it’s one of the best–if not the best way–to measure a site’s organic search visibility.
Knowing the top ten (and more) keywords users search for to find your site is invaluable information. Once you understand your customer’s search intent, you can optimize for that through content production and smart SEO tactics.
Keyword rankings tell you which phrases are pulling your site into search results and which aren’t. The decision on what to optimize for is up to you, but without this data, you’re basically flying blind.
3. Backlink profile
Backlinks are hyperlinks pointing to your site from other sites and are also called “external links.” For example, if Huffington Post creates a blog article about gardening and links to my humble, little self-published blog, my site has now acquired a backlink from one of the biggest websites in the world.
Google understands this transference of power and takes it into account like this:
When a site with high domain authority links to you, you effectively receive some of that site’s “Google juice” and your domain authority receives a slight bump. Get enough high ranking sites to link to you and your backlink profile goes up along with your domain authority.
Guest blogging is a great way to promote your site as well as increasing your backlink profile. Consistently create content people find valuable, as a general rule of thumb, and you’ll find sites will organically link to you.
4. Page experience
Google describes page experience as “a set of signals that measure how users perceive the experience of interacting with a web page beyond its pure information value.”
In other words, page experience is a user’s ability to navigate a site with speed and efficiency. Page experience has little to do with content optimization, instead focusing on these four factors:
- Core Web Vitals consists of loading time, interactivity, and visual stability.
- Mobile-friendly refers to a site’s ability to load properly on mobile devices. (Check out Google’s Mobile-friendly test to check if your website is mobile device ready)
- HTTPS is a more secure connection than HTTP
- No intrusive interstitials
5. SERP real estate
A search engine results page (SERPs) is where most companies live or die. If you’re not popping up on page one for a search term related to your business, you better be really good at social media, ads, cold calling, or some other form of client acquisition.
There’s a bevy of features on Google’s search results pages: featured snippets, ads, local results, reviews, shopping carousels, and more. Sure, you can occupy the first or second spot on a SERP and attract loads of business. But, how much more business would you get if you took a top spot plus a featured snippet? Data suggests your conversions would double.
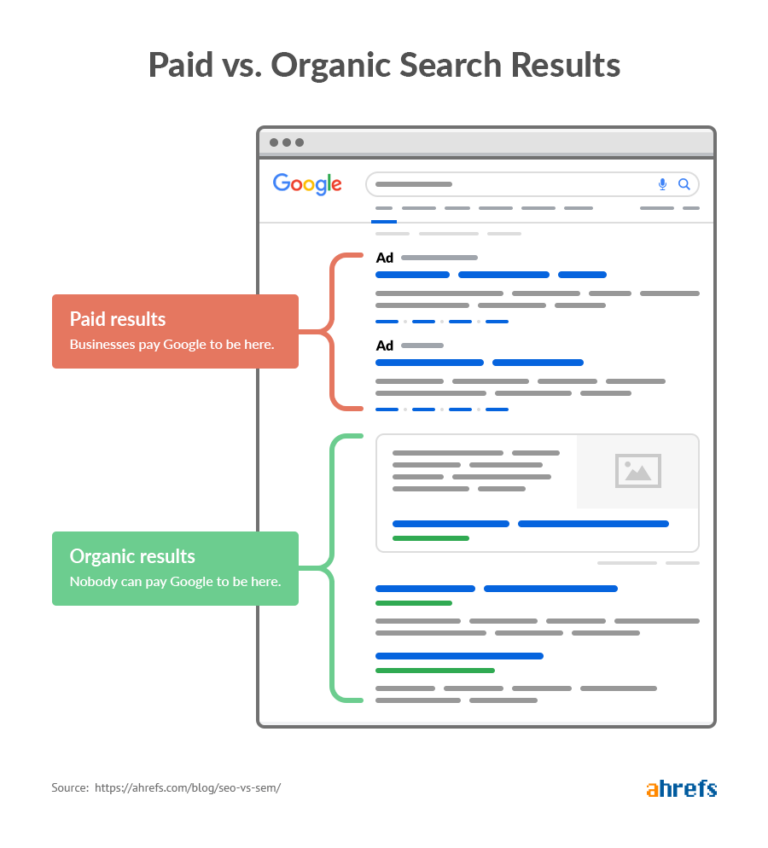
Credit: Ahrefs
“SERP real estate” is the amount of space you take up on a search results page. With all of the new features Google continues adding to SERPs, there’s multiple opportunities to place on page one. The more “real estate” you take up on a SERP, the higher the likelihood you get clicked on. The more clicks you get, the more conversions you get.
So, it’s simple–occupy as much space on a SERP as possible. Doing so reduces your competition, compounds your conversions, and keeps you ahead of the SEO game.
Social Media Metrics
1. New followers and follower growth rate
One of the primary metrics for almost every social media platform is the follower or subscriber count. When someone “follows” you on social media, they are subscribing to your native content on that platform.
When you release new content, they’re in a pool of people privy to your posts (not all of your followers see your content organically but that’s a topic for another time).
Follower growth rate, then, is the percentage rate followers add themselves to your subscriber list over a set period of time. To get your follower growth rate:
Follower Rate = (# of new followers / total number of followers) x 100
You can change the time period in the first part of the formula to any time period you’d like, but to see how you’re currently growing, opt for the last 30 days.
The reason why you want to determine your follower growth rate is to compare and measure your growth. You can’t compare with MegaStore X’s 10,000 new subscribers per month, but you can do the math and see what their rate is. If your rate is similar, then you know you’re on the right track. If not, adjust, keep producing content and testing variables.
2. Engagement rate (likes, comments, shares)
Much like follower growth rate, your engagement rate is a measurement describing your content’s effectiveness. Engagement metrics are, for the most part, likes, comments, and shares. Anytime someone takes an action on your content or site, that is considered an engagement.
Engagement rate is calculated in several ways depending on the platform and the goal. The formula for Instagram, for instance, would look something like this:
Engagement rate = (Likes + Comments) / Followers x 100
For a more accurate look at your engagement rate, you can substitute “followers” with “impressions.” The only drawback to that method is you cannot retrieve impression data from competitors. Therefore, for competitive research purposes, use the follower formula.
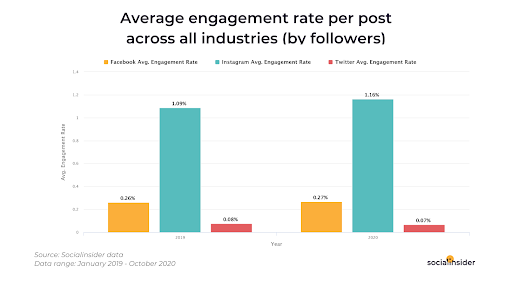
Credit: Social Insider
Engagement rate is important because it, first, tells you how well your content is doing compared to other pieces of content. High engagement rates mean your content is popular and getting attention. Low engagement rates signal the content or page needs reworking.
Second, you can compare your content to peers and competitors. This allows you to gauge how well you’re doing compared to others in your market. Again, you won’t be able to compare your total engagements to MegaStore X, but you can check out their percentage rate and see if yours is comparable.
3. Social media traffic
Social media traffic is a form of “referral traffic.” Referral traffic comes to your page from another destination. If you post a link to your site on Facebook, for example, and someone clicks it, they are considered referral traffic from Facebook and tagged as so in Google Analytics (or any analytics software).
This is great data to keep a constant eye on because it instantly tells you which platform is referring traffic to your site the most. Once you understand that, you can focus your energies into that platform, optimizing and leveraging it for increased traffic and conversions.
You may have to do a little bit of UTM tracking for Google Analytics to properly attribute traffic to the correct platform. Take the time to do this if necessary–social media traffic data is invaluable.
4. Social media conversions/leads
Social media conversions & leads is the amount of social media traffic you convert into clients or customers. One way to get this data is to use a tool like Google Analytics and trace your customer’s journey back to where they jumped onto your page. If they convert directly from social media–such as clicking to buy inside the app–your native social media analytics have that data.
Like social media traffic, you want to attribute where your conversions and leads are coming from so you can focus and optimize that channel as best as possible. Also, remember your definition of “conversion” depends on your goals. If you’re not selling a product, then your social media conversion will be something like a jump to a squeeze page from YouTube.
Whatever your conversion is, make sure you’re tracking it. Social media is a powerful tool for converting potential customers into cash cow clients but only if you’re following your data correctly.
Email Metrics
1. Traffic
Email traffic refers to the amount of users your email was sent to as well as the number of sessions initiated. Sessions initiated is just another way of saying engagement, so anytime someone opens your email, replies, or clicks a link, that is a session. Email software, like Aweber and MailChimp, have this data in their native analytics.
With email traffic data, you’ll understand email engagement rate and see how well your emails are performing compared to each other as well as your competitors. The formula looks like this:
Email engagement rate = (Sessions / Users) x 100
2. Signups/Subscriptions
Your email list is a direct line of communication to clients and candidates and one of the most valuable assets a company has. Signups & subscriptions refers to the amount of people signing up to your email list. The platform that records the signup normally has this data in its analytics.
It’s vital to your email marketing efforts that you keep an eye on the flow of subscribers to your email list. This tells you how your marketing efforts–e.g. squeeze pages & pop-ups are performing. If you see your sign ups begin to slow down, that’s a sign your lead magnet or sign-up form needs some work.
Quick tip: Try eliminating a field or two from your signup form. Multiple studies show less fields increase email signup rate.
3. Open rates
Your open rate, sometimes referred to as email click-through rate, is the percentage of total emails received that were opened. It’s calculated like this:
Email Open Rate = (Email Opens / Emails Received) x 100
Credit: Hubspot
As more people open your emails, your conversion rate–candidates clicking through and becoming customers– also increases (considering your offer is solid).
Quick Tip: Check out Co-Schedule’s Email Subject Line Tester to get an idea of how your email open rate may perform.
PPC Metrics
1. Cost per click
Cost per click, CPC for the initiated, is a metric that describes how much one click on an ad costs. When you’re CPC bidding in Google Ads, for example, you’ll set a maximum cost per click–this is your way of telling Google you’re not interested in paying more than that for each click on your ad.
The more universal understanding of CPC refers to the metric you’ll see prominently in Google or Facebook Analytics. When running an ad campaign with automatic bidding, average CPC values (total ad campaign cost / total number of clicks x 100) play an important role in letting you know how well your ad is performing.
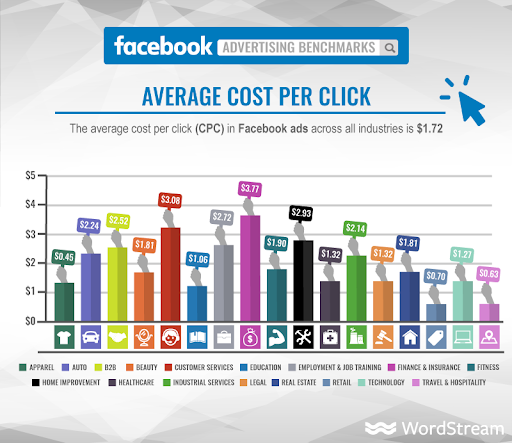
Credit: WordStream
According to Wordstream, the average Google AdWords CPC (all industries) is $2.32 for search ads and $0.58 for display ads. That said, look to your industry benchmarks for better correlating information as average CPC across industries varies greatly. You want your average CPC to be low, of course, but not by sacrificing quality traffic.
Quick tip: The higher the “quality score” on your ad, the lower the CPC will normally be. Focus on getting a high quality score by adhering to platform guidelines and optimizing ad text, among other strategies.
2. Click-through rate (CTR)
Click-through rate, or CTR, is the number of ad clicks per number of impressions (times an ad was seen). In other words, CTR represents the percentage of people that clicked on your ad out of all the times it was seen. It’s calculated as so:
Click-Through Rate = (Total Clicks on Ad / Total Impressions) x 100
CTR is easily ascertained from your ad platform’s native analytics and directly affects an ad’s quality score. A high quality score allows you to maintain or improve ad position for a lower cost. According to Wordstream, average CTR for Google AdWords is 1.91% (search network) and 0.35% (display network).
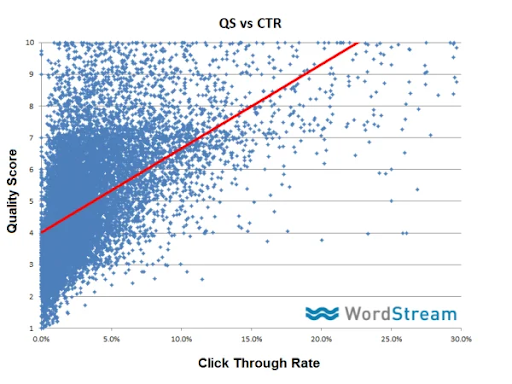
Credit: WordStream
A high CTR isn’t always great, though. If a keyword isn’t relevant to your business and your CTR is high for that term, you’re buying traffic that isn’t likely to convert and essentially wasting money. Always make sure your keywords have the proper search intent behind them.
Quick tip: A/B testing is a great way to ensure your ad is optimized and achieving a high click-through rate. Try A/B testing images, headlines, body copy, CTAs, and more. Remember: test one variable at a time or you won’t know which is promoting data changes.
3. Impression share
Impression metrics track how prominent your ads are. They’re calculated in two ways: impression share and absolute top impression share (ATIS). The formula to get your ad’s impression share is as follows:
Impression share = Impressions / Total Eligible Impressions
Eligible impressions are calculated using targeting settings, approval statuses, and ad quality. Google also looks at comparable ads from other marketers before coming to this estimate.
Knowing an ad’s impression share helps marketers understand if the ad reaches more people if the bid or budget is increased. The last thing you want to do is leave money on the table if your ad is performing well. Therefore, watching an ad’s impression share clues you in to when it’s time to open up the purse strings.
4. Total conversion value
Total conversion value is the sum of all conversions over a specific period of time. Let’s say, for instance, you want to tally up the total revenue from an ad campaign. Total conversion value, then, would be the metric to look for.
Since conversions can hold different values, even customized values, the only way to calculate this figure is to manually add up your conversions across an entire campaign. Native analytics makes this easy by providing conversion amounts for each segment so simply add them up and you’ll come to a total conversion value.
The reason why you want to calculate total conversion value is to determine how much revenue a campaign earned. This metric ties in closely with ROI and ROAS.
5. Return on ad spend (ROAS)
Return on ad spend is a metric referring to the amount of revenue received for each dollar spent on advertising. ROAS is similar to ROI (see: no. 1) in that it simply measures income versus expenditure. Where it differs is in the area it’s generating revenue from–ROAS is only concerned with advertising budgets and the revenue seen from ad conversions.
ROAS can be discerned at every level of your ad account including the ad group, campaign, and account levels. The formula for ROAS is pretty simple:
ROAS = Conversion Value / Ad Spend
Divide the value of your offer (i.e. product price) by the amount it takes in ad spend to make one sale and you’ll have a solid ROAS. With this metric, you’ll have a better idea of how your ad campaigns are performing and if your budget or creative needs to be adjusted.
Identifying the Right Marketing Metrics to measure
Okay, we looked at a bunch of metrics, but which ones do you track now? For the answer to that, look to your competition and industry.
The telltale sign a key performance indicator (KPI) is worth tracking is if it stands solely as a success measurement in your industry and market. For example, if you sell ice cream and ice cream stores are ranked on the gallons per day they sell, you better be counting how many gallons of ice cream you’re peddling per day.
That’s a silly example, but you get the point. Look at how success is measured in your industry, how competitors measure their success, and you’ll have a great starting point for understanding which key performance indicators to track. Otherwise, refer to this handy guide whenever you get stuck and you’ll be in great standing!
How The Customer Perspective Influences Your Marketing Metrics
The customer perspective is vital for creating campaigns and strategies that are successful. Now more than ever, personable marketing makes a significant impact on how customers perceive your business or brand, so you’ll need to tailor your marketing, channels, and campaigns accordingly.
While it’s essential to track consumer metrics and performance metrics, don’t overlook brand metrics. The goal of these metrics is to track the attributes of your brand; this is increasingly more important as your campaigns and ads become more personalized for the end customer. These metrics, like brand preference and brand loyalty, will show you how to improve the customer’s experience with your brand and give you the insight to improve your marketing.
Beyond the Metrics: Using Non-Marketing Data To Inform Your Strategies
An outside perspective, or rather a complementary perspective, is very beneficial to have when looking at the success of a campaign with context. This is important because, on paper, the campaign may have performed well, but in actuality, due to context from another factor, it actually didn’t. Context is key to understanding the results of your campaigns to know if they were effective. A combination of qualitative and quantitative data will go a long way to creating context and insight.
Finding a Fractional CMO to guide your marketing efforts
You can read about the top marketing metrics all day long (and we appreciate it!) but the fact remains that reading is no substitute for legitimate experience. With a fractional CMO, you’re not just buying a great marketing executive at a reduced cost, you’re purchasing the knowledge and experience a marketer brings to your company. The value you’ll receive from a fractional CMO is akin to 10+ years of reading amazing articles like this one.
If you’d like more information about how a fractional CMO can boost your company’s bottom line, align values with marketing vision, and push your business to a new tax bracket, schedule a call with CMOx today!